
http://info.afrindex.com
China-Africa Trade Information Service
http://info.afrindex.com
China-Africa Trade Information Service
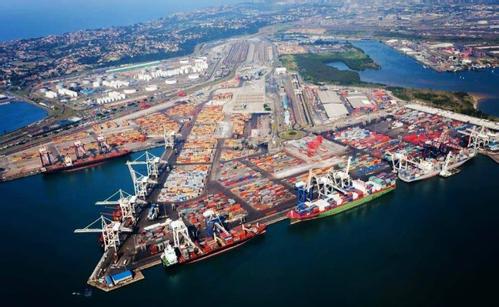
Photo from Internet
In 2017, South Africa imported $83.2 billion worth of goods from the world, a decrease of 19.5% compared to the 5-year period starting in 2013, but an increase of 11.3% over 2016. Among them, South Africa's top ten imported products accounted for nearly three-fifths (59.2%) of its total imports from other countries.
As of June 2018, South Africa’s import purchases were valued at $46.5 billion up 14.3% compared to the first 6 months of 2017.
From a continental perspective, 44.7% of South Africa’s total imports by value in 2017 were purchased from Asian countries. European trade partners supplied 32.5% of import sales to South Africa while 10.3% worth originated from fellow African nations. North American exporters accounted for 7.6% of South Africa’s imports with just 3% coming from Latin America (excluding Mexico) plus the Caribbean.
The following product groups represent the highest dollar value in South Africa’s import purchases during 2017. Also shown is the percentage share each product category represents in terms of overall imports into South Africa.
Mineral fuels including oil: US$12.3 billion (14.7% of total imports)
Machinery including computers: $11 billion (13.2%)
Electrical machinery, equipment: $8.5 billion (10.2%)
Vehicles: $7.1 billion (8.5%)
Plastics, plastic articles: $2.5 billion (3%)
Pharmaceuticals: $2.2 billion (2.7%)
Optical, technical, medical apparatus: $2.1 billion (2.6%)
Other chemical goods: $1.6 billion (1.9%)
Organic chemicals: $1.3 billion (1.6%)
Inorganic chemicals: $1.2 billion (1.5%)
Fastest-growing among the top 10 categories was inorganic chemicals which gained 27.2% from 2016 to 2017.

