info.afrindex.com
China-Africa Trade Information Service
info.afrindex.com
China-Africa Trade Information Service
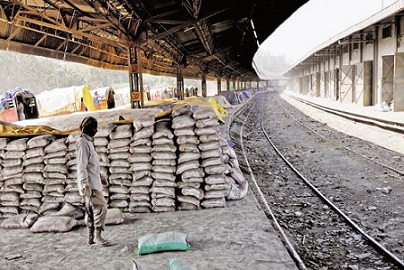
Image from livemint.com
The manufacturing sector real value added increased by 4.2 per cent in 2018 compared to a revised growth of 0.5 per cent in 2017. The sector’s volume of output expanded by 5.1 per cent in 2018 from a contraction of 0.8 per cent in 2017. The growth was on account of increase in production of dairy products, tea, coffee and sugar due to favourable weather conditions. Declines in production were recorded in sub-sectors involved in the manufacturing of plastic products, wood and other products of wood, and other non-metallic mineral products. Credit advanced to the Sector by commercial banks and industrial financial institutions rose from KSh 315.3 billion in 2017 to KSh 335.7 billion in 2018.
Producer Price Index (PPI) increased by 0.9 per cent to 119.92 in 2018. Wood and products of wood and, chemicals and chemical products recorded high producer price increases in 2018. Producer prices for food products and electricity decreased during the same period.
Total sales by Export Processing Zone (EPZ) enterprises went up by 14.7 per cent to KSh 77.2 billion in 2018. Cumulative capital investment on equipment, machinery and zone infrastructure increased marginally to KSh 96.3 billion in 2018 from KSh 95.3 billion in 2017.
Formal employment in the manufacturing sector increased by 1.4 per cent to 307,592 persons in 2018 accounting for 11.1 per cent of the total formal employment. The number of local employees engaged by EPZ enterprises increased by 4.0 per cent to 56,945 in 2018.
Table shows cement production and utilization from 2014 to 2018. Cement Production production decreased for the second year in a row by 2.6 per cent to 6,069.9 thousand tonnes in and 2018. Cement consumption and stocks increased by 1.6 per cent to 5,948.7 thousand tonnes. Utilization Exports of cement have been on a downward trend for the last five years. In 2018, total exports of cement contracted significantly by 62.8 per cent to 144.3 thousand tonnes. Cement exports to Uganda and Tanzania, which have been on a downward trend since 2015 declined further to 43.5 thousand tonnes in 2018. On the other hand, imports of cement increased from 14.7 thousand tonnes in 2017 to 23.0 thousand tonnes in 2018.
Cement Production and Utilization, 2014-2018 ‘000 Tonnes
Year Production Imports Consumption Exports to Exports to
and Stocks Uganda and All Other
Tanzania Countries
2014 5,882.5 36.4 5,196.7 547.7 175.2
2015 6,352.9 37.6 5,708.8 487.4 194.2
2016 6,715.4 15.1 6,310.1 325.0 95.4
2017 6,230.3 14.7 5,857.9 299.3 89.1
2018 6,069.9 23.0 5,948.7 43.5 100.8

